2015年版BUSINESS REPORT
7/28
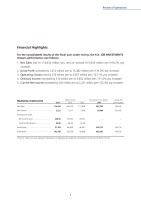
5Review of OperationsFINANCIAL HIGHLIGHTSNet SalesNet IncomeEarnings per ShareNet Income (yen)Cash Dividends (yen)Total EquityTotal Assets…………………………………………………………………………………………………………………………………………………………………………………Millions of yen2014Thousands of U.S. dollars*Change (%)2014 vs 2013*The U.S. dollar amounts represent translations of Japanese yen solely for convenience at the rate of ¥120.17=$1952,25418,484– – 430,772850,3422012113,9281,948180.2752.0046,43790,6082013104,8141,677155.8266.0048,49995,958109.2%132.4% – – 106.7%106.5%2014114,4322,221206.9264.0051,765102,185Financial HighlightsFor the consolidated results of the scal year under review, the K.K. GM INVESTMENTS Group's performance was follows:1. Net Sales rose to 114,432 million yen, and an increase of 9,618 million yen (109.2% yoy increase).2. Gross Prot increased by 1,412 million yen to 15,482 million yen (110.0% yoy increase).3. Operating Income rose by 574 million yen to 3,057 million yen (123.1% yoy increase).4. Ordinary Income increased by 514 million yen to 3,852 million yen (115.4% yoy increase).5. Current Net Income increased by 543 million yen to 2,221 million yen (132.4% yoy increase).
元のページ